Documentation

Select a category on the left, to get your answers quickly

Opensolr Basic User Guide with Integrations

Overview

Opensolr provides a fully managed Apache Solr hosting service that allows you to create and manage search indexes, connect external websites (Drupal, WordPress, or custom-built), and use Solr Search APIs easily without managing your own servers.


1. Getting Started

Create an Account

  1. Go to https://opensolr.com.
  2. Click Sign Up and create your account.
  3. Confirm your email and log in to the Opensolr Control Panel.

Access the Control Panel

  • After logging in, you’ll be directed to the Dashboard.
  • Here, you can manage Solr indexes, configurations, API keys, and user access.

2. Creating a Solr index

  1. In your dashboard, click New index.
  2. Choose the Solr version that matches your application (e.g., 8.x or 9.x).
  3. Give your index a name (e.g., drupal_search, wordpress_search, or custom_site).
  4. Click Create.
  5. Wait a few seconds for the index to initialize. Once ready, you’ll see connection details like:
    • Solr Core URL
    • Hostname and Port
    • index name
    • Authentication credentials (if enabled)

3. Connecting Drupal to Opensolr

Install Required Modules

  1. In your Drupal admin panel, install:
  2. Enable both modules.

Configure the Search Server

  1. Go to Configuration → Search and Metadata → Search API.
  2. Click Add Server.
  3. Fill in the following:
    • Name: Opensolr Search
    • Backend: Solr
    • Solr Host: Provided by Opensolr (e.g., server-name.opensolr.com)
  4. Save the server and test the connection — it should say “The Solr server could be reached successfully.”

Add an Index

  1. Under Search API, click Add Index.
  2. Choose your content types (e.g., Articles, Pages).
  3. Assign your newly created Opensolr server to the index.
  4. Save and index your content.

Your Drupal site is now powered by Opensolr.


4. Connecting WordPress to Opensolr

Install a Plugin

  1. From the WordPress dashboard, go to Plugins → Add New.
  2. Search for “Search with Solr” or “WPSOLR”.
  3. Install and activate the plugin.

Configure Plugin Settings

  1. Navigate to Settings → Solr Search.
  2. Fill in your Opensolr connection details:
    • Solr Host: e.g., https://yourdomain.opensolr.com/solr/wordpress_search
    • Port: 443 (for HTTPS)
    • Path: /solr/wordpress_search
  3. Save settings and reindex your site content.

Your WordPress search now uses Opensolr for fast and accurate results.


5. Integrating a Custom Website via Search API

If you have a custom PHP, Python, or Node.js website, you can interact directly with Opensolr’s Search API.

Example using cURL

curl "https://yourdomain.opensolr.com/solr/custom_site/select?q=example&rows=5&wt=json"

Example using PHP

<?php
$url = "https://yourdomain.opensolr.com/solr/custom_site/select?q=example&wt=json";
$response = file_get_contents($url);
$data = json_decode($response, true);
print_r($data);
?>

Example using JavaScript (Fetch API)

fetch("https://yourdomain.opensolr.com/solr/custom_site/select?q=example&wt=json")
  .then(res => res.json())
  .then(data => console.log(data));

6. Testing Your Integration

  1. Index some test data or publish content.
  2. Run a search from your website.
  3. Verify that results match your Opensolr index.

7. Troubleshooting

Issue Possible Cause Solution
Cannot connect to Solr Wrong hostname or index name Verify your Opensolr connection URL
No search results Schema mismatch or unindexed data Reindex your content or update schema
Plugin error in Drupal/WordPress Version incompatibility Update Solr module/plugin to latest version

8. Resources

Real-Time Solr Monitoring & Analytics

Monitor Your Search Performance Like Never Before

OpenSolr brings enterprise-grade monitoring directly into your dashboard. No setup, no configuration, no external tools - just powerful real-time insights into your Solr infrastructure the moment you need them.


📈 Live Query Volume Tracking

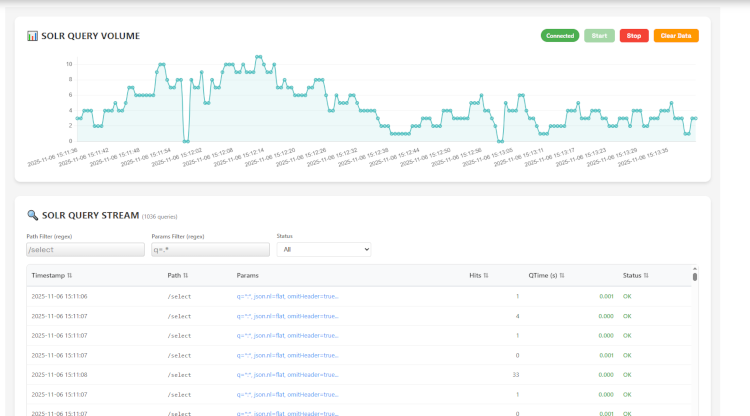
Solr Query Volume Chart

See your search traffic as it happens. Our real-time query volume chart updates every second, giving you instant visibility into traffic patterns, usage spikes, and query trends.

Perfect for:

  • Identifying traffic patterns and peak usage times
  • Capacity planning and scaling decisions
  • Detecting unusual activity or traffic spikes
  • Understanding user behavior in real-time

🔍 Complete Query Stream Analysis

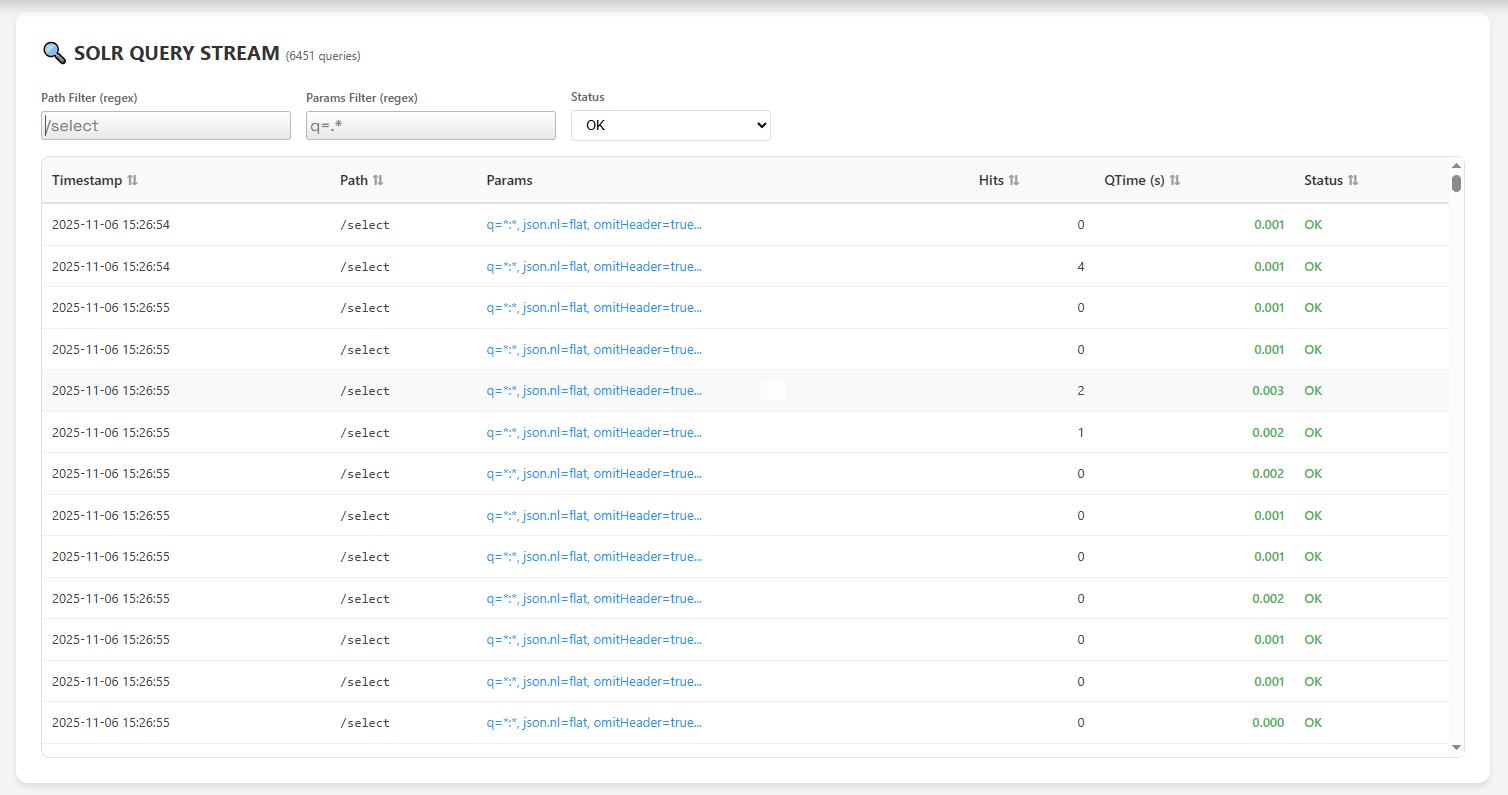
Query Stream Table

Every query that hits your Solr index is captured and displayed in real-time. See exactly what your users are searching for, how long queries take, and which searches are performing well.

What You Get:

  • Timestamp Precision - Track when every query executed
  • Full Query Details - See paths, parameters, and search terms
  • Performance Metrics - Response times displayed to the millisecond
  • Result Counts - Understand how many hits each query returns
  • Status Monitoring - Catch errors and issues instantly

Smart Filtering lets you search through thousands of queries using regex patterns on paths and parameters. Find exactly what you're looking for in seconds.


🔬 Deep Query Inspection

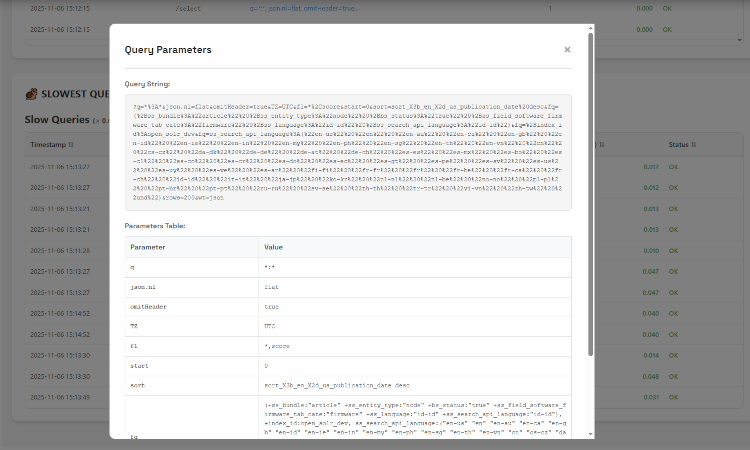
Query Parameters Modal

Click any query to see the complete breakdown. Every parameter, every filter, every detail - presented clearly and ready to analyze or test.

See Everything:

  • Complete query string ready to copy and test
  • All parameters displayed in an easy-to-read table
  • Multi-value parameters (like filter queries) shown properly
  • Clean formatting - no URL encoding clutter

Perfect for debugging, optimization, and understanding exactly what your application is sending to Solr.


⚡ Smart Slow Query Detection

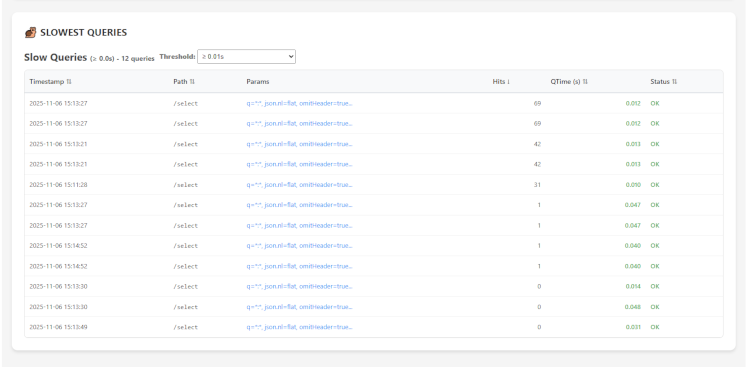
Slow Queries Table

Slow queries hurt user experience and waste resources. Our intelligent slow query monitor automatically identifies and tracks queries that need attention.

Customizable Thresholds: Set your own definition of "slow" - from 0.2 seconds to 1.0 seconds - and let OpenSolr automatically flag queries that exceed your threshold.

Why It Matters:

  • Identify optimization opportunities
  • Find queries that need better indexing
  • Track performance improvements over time
  • Proactively address issues before users complain

Queries are sorted by response time, putting your slowest queries front and center where they belong.


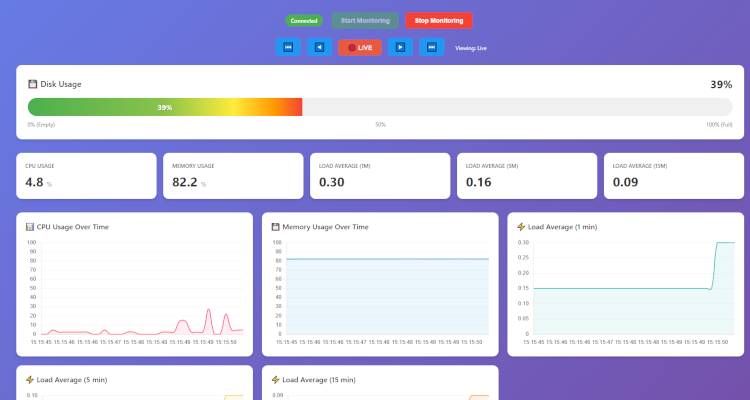
🖥️ Real-Time Server Health Monitoring

Server Stats Dashboard

Your Solr server's vital signs, updated live. Monitor CPU, memory, disk usage, and load averages - all in one beautiful dashboard.

System Metrics Include:

  • CPU Usage - Real-time processor utilization with trend graphs
  • Memory Consumption - RAM usage tracking over time
  • System Load - 1, 5, and 15-minute load averages
  • Disk Capacity - Visual indicators show available space at a glance

Everything updates automatically - no refreshing needed. Just watch your infrastructure perform.


🎯 Getting Started

Accessing your monitoring dashboard is simple:

  1. Log into your OpenSolr Control Panel
  2. Select any of your Solr indexes
  3. Find the monitoring options in the left sidebar:
    • "Solr Log" for real-time query monitoring
    • "Server Monitor" for system health metrics

That's it. Your monitoring is already running, already collecting data, already ready to use.


✨ Why OpenSolr Monitoring Stands Out

Built for the way you work:

  • Zero Setup - Start monitoring the moment you create an index
  • Real-Time Updates - See changes as they happen, not minutes later
  • Millisecond Precision - Accurate performance metrics you can trust
  • Intelligent Filtering - Find the queries that matter
  • Always Included - No extra fees, no add-ons, no hidden costs

Professional tools at your fingertips: Every OpenSolr account includes full monitoring capabilities. Whether you're running a small blog or a high-traffic e-commerce platform, you get the same powerful insights.


💡 Real-World Benefits

For Developers: Debug issues faster, optimize queries with confidence, and understand exactly how your search is performing in production.

For Operations: Monitor server health, plan capacity needs, and catch problems before they impact users.

For Business: Understand search usage patterns, improve user experience, and make data-driven decisions about your search infrastructure.


🚀 The OpenSolr Advantage

Professional search infrastructure shouldn't require enterprise budgets or DevOps teams. OpenSolr delivers powerful, production-ready monitoring as part of every account.

This is what modern search infrastructure looks like.


Monitoring is included with all OpenSolr plans. Log in now to start exploring your data.

Need help? Our team is here: support@opensolr.com | Documentation

How to Create a New Opensolr Index (and Look Like a Pro Doing It)

Creating a new Opensolr Index is easier than brewing your morning coffee (and just as satisfying, minus the caffeine jitters ☕).

You can do this the classic way—using the Opensolr Control Panel—or you can show off your automation chops with the Opensolr Automation REST API.

But let’s stick to the tried-and-true Control Panel way. Here’s your step-by-step path to Solr greatness (US-EAST, Solr 7 in this example):


  1. Login to your Opensolr Account

    Login to Opensolr Account
  2. Click on the Control Panel link
    (You'll find this in the top-right corner of your user menu.)

    Solr Cloud Control Panel
  3. Inside your Control Panel Dashboard, click “Add New”
    (Look for it at the top of your Control Panel menu options.)

    Add New Solr Index
  4. Choose your desired region, Solr version, and country
    (Use the filters on the regions list to pick the perfect spot for your index.)

    Select Opensolr Region
  5. Click on your desired region
    (Or use “Request Env.” if you want something custom.)

    Select Solr Cloud Region
  6. Name your index
    (Or leave the auto-generated unique ID—mystery is always fun. Click Add Index!)

    Name Solr Cloud Index
  7. Click your index name to access your Index Control Panel

    Solr Cloud Index Control Panel
  8. Update the Solr Configuration Files
    (Either edit them live, or upload a new Solr Config Zip from Drupal, or your own.)

    Setup your Solr Configuration Files

💡 Tips for Power Users

  • Using the API? You’re basically Neo from the Matrix. Check the API docs for all the cool moves.
  • Each region and version may have different features and performance profiles—pick what fits your use case best.
  • Always remember: naming your index something funny will amuse your future self.

Welcome to the big leagues of Solr search! 🏆

The OpenSolr Solr Manager Control Panel

Welcome to The OpenSolr Solr Manager Control Panel—your trusty co-pilot for navigating the world of Solr instances, minus the headaches. Whether you’re a seasoned search sorcerer or a mere mortal just dipping your toes into Solr waters, this web-based interface has your back.

Why Use the OpenSolr Control Panel? 🤔

Let’s face it—directly wrangling Solr configs is about as fun as debugging regex at 2am. That’s where the OpenSolr Solr Control Panel UI comes in:

  • Not a replacement, but an enhancement: This custom control panel works hand-in-glove with the native Solr Admin Panel and Solr Core Admin API, bringing efficiency and user-friendliness to the next level.
  • Designed for everyone: You don’t need a PhD in Lucene to use it. The intuitive interface opens Solr’s power to a wider audience, democratizing access to enterprise-grade search technology.
  • Seamless integration: Enjoy the best of both worlds—the raw power of Solr and a UI that doesn’t make you want to pull your hair out.

Features That Make Life Easier ✨

Here’s what you (and your sanity) can look forward to:

  1. Instance Management: Create, delete, start, stop, and manage multiple Solr instances—all without breaking a sweat.
  2. Schema Management: Define fields, types, and configurations via a clean visual interface. No more hunting through XML unless you’re into that sort of thing.
  3. Indexing and Importing Data: Upload, index, and import data in CSV, JSON, XML, and more. If you can spell it, you can probably import it.
  4. Query Interface: Run queries against your Solr index and review results in real time. Yes, instant gratification is a feature.
  5. Monitoring and Metrics: Visual dashboards for performance, index stats, and query health. Stay ahead of surprises.
  6. Security and Authentication: Manage access control, authentication, and authorization like a pro.
  7. Configuration and Tuning: Fine-tune settings, request handlers, and cache with easy tools.
  8. Alerts and Notifications: Get notified before things go sideways. Set thresholds, and let the panel keep watch.
  9. Backup and Restore: Schedule backups, restore when needed, and sleep easier at night.

Note: Features may vary by provider, but this is the typical menu you’ll see on a Solr Manager Control Panel near you.

The Bottom Line

Opensolr’s bespoke Control Panel UI is a game-changer for search engine management. It combines Solr’s muscle with a user-friendly, customizable experience, making advanced search tech both accessible and efficient for everyone from startups to search veterans. Now you can focus on what matters—without worrying if your search setup will go full textpocalypse.


Questions? Feedback? Or just want to geek out about search? Get in touch!


Review us on Google Business
ISO-9001 CERTIFIED ISO-27001 CERTIFIED
🔍 Use the AI Search to get answers!